From the classroom to the boardroom and factory floor, learning is something we all have in common. As a result, finding ways to improve and optimise learning experiences has become increasingly crucial for educators, trainers and companies alike.
Learning analytics can be an incredibly powerful tool that helps us better understand how employees learn, leading to improved performance.
This article will cover what learning analytics are, why they matter, and how your organisation can get started with them!
For example, you might be an HR professional tasked with training the company’s new hires. You’ve been hearing more and more about the concept of learning analytics but aren’t sure what it is or how to use it in your day-to-day work. Learning analytics has the potential to help you understand which courses are most effective for each learner based on their personal preferences and needs.
This information can be used to improve future programs by tailoring content to specific learners, so they get a better education from day one.
The use of learning analytics is more than just about measuring the effectiveness of a course. It’s also about understanding how learners are using the content and what they need help with. This data can be used to improve courses, measure success rates, and create better training programs for your organisation.
What exactly are these mysterious learning analytics numbers? And should you really care
Data and Analytics are popular topics these days as almost every web-based software provides some form of analytics. Most of our online activities contribute to various analytics metrics and for better or worse.
Analytics is the process of interpreting, discovering, and communicating significant patterns in data. Simply put, analytics is the process of finding trends. Simpler still, analytics finds out what happened in the past and uses this information to predict and influence what might happen in the future.
Now, that above definition might have already sparked some thoughts about why analytics are helpful or valuable to different situations. Analytics can provide insights and information that allow for better decisions to be made and optimise the performance.
While we can see the usefulness of analytics in various products and services throughout the learning and education sector (and maybe others as well), they are frequently underutilised.
A lot of it has to do with the fact that learning and education are highly subjective and qualitative, making it challenging to quantify experiences and actions. Another reason is the widely held belief that this is true, which leads to a general unwillingness to investigate or identify aspects of, or ways learning experiences might be quantified, resulting in a lack of knowledge about what we can learn.
What can you use analytics for?
So, what kind of analytics can be gathered on complex, subjective experiences such as learning? Using digital learning technologies and online learning means collecting data on everything is easy but not necessarily valuable. How can we cut through the noise and identify usable metrics? It might help to begin by thinking about various categories of measurement that might be useful in determining the successes and shortcomings of a learning experience. How will you define “success”? Is it in completing all course modules, passing a test, or earning a certificate?
If we do this, one of the first things that might come to mind are measurements related to learners’ time and frequency of learner’s study habits. Such measures are extraordinary at providing a clear snapshot of how much time is spent, when/how often study time occurs, and what materials or content focus is directed. We can gain some general perceptions about the levels of commitment. Motivation and engagement of learners and how much “work” has been done related to the course learning. This can take many forms but is often essential, resulting in a progress tracking feature that lets learners and instructors know what has been done. While this might be useful at a basic level, it is not very interesting nor provides much insight into the actual learning process or experience.
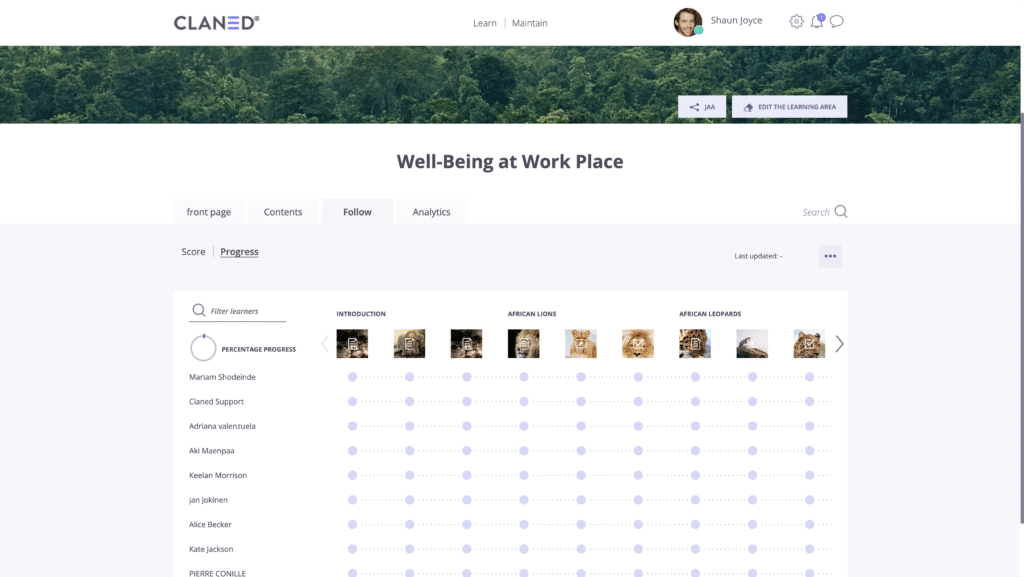
Let’s take a look at using some learning analytics in practice
For many people, the ideas stop around visibility into learners’ activities like the above. That’s understandable because, as mentioned, the learning experience is a notoriously tricky thing to measure and even thinking about how to do it can be challenging. However, with the rise of AI and machine learning technologies, we can develop more sophisticated measures that cut to the core of learning experiences.
For instance, we run a program that analyses all the course content and distinguishes topics within them. We can produce analytics exposing which topics get the most attention and which the least. We could take this a step further and show which content specifically makes up these topics. How popular they are (how often they are viewed or revisited and for how long) within the topic category they belong to and the course as a whole.
Suppose this information is combined with additional measures. In that case, we can start to paint a detailed picture of what content attracts attention, if it’s enjoyable or challenging, boring or (generally) considered trivial. These measures provide excellent feedback about the content and structure of courses and spotlight particularly successful aspects and those that require improvement.
An Example: Feedback
Another example, feedback. Asking learners to fill out a feedback form upon the conclusion of a course has long been standard practice in learning. While this is still a creditable practice, it has one major flaw, the passage of time. If a course runs for three months and you ask participants to reflect on the entire experience at the end of it. Their feeling towards some aspects of the experience or contents covered during the first three weeks or even the first two months may not be accurate. This makes it challenging to get meaningful feedback.
It is no fault of anyone; it’s just how the brain and memory function in general. We have a more difficult time recalling our exact feelings on past experiences the longer ago they occurred. On top of that, our memories of past reactions are likely to be influenced by our present conditions. So, if a learner receives a grade they don’t like or feel they didn’t deserve or had a powerful experience towards the end of the course, this may colour their perception of it in its entirety.
So how do we gather information about an individual’s perception of a learning experience? Or content in the moment they are engaged with it? One answer might be to include feedback forms and questions regularly. However, having to write a response about one’s reactions and learning experience to content or module every time it is completed becomes laborious. It interrupts the workflow and can become such an annoyance to learners that it has the opposite impact than intended.
Luckily, there’s a solution
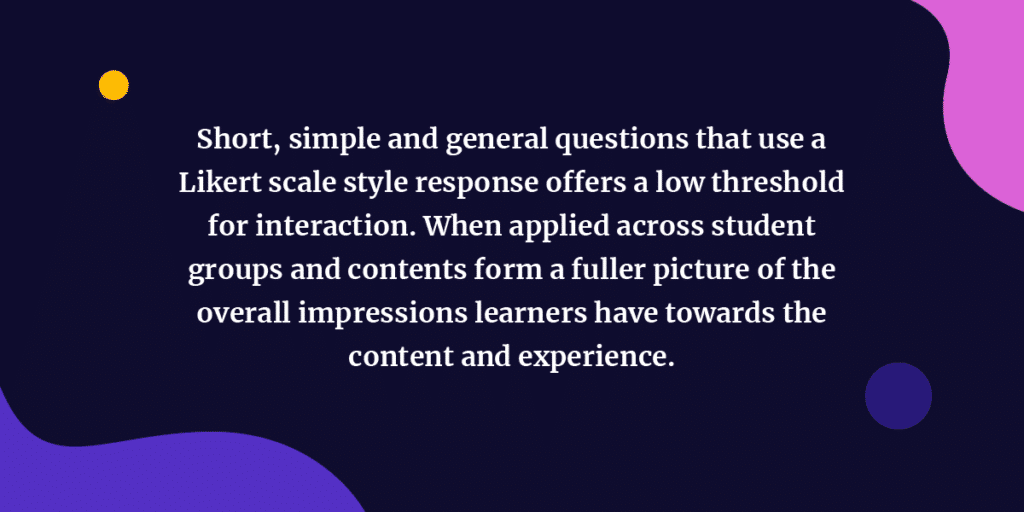
Luckily, it turns out there is a solution that allows us to gather in-situation feedback about learners’ subjective experience of the learning materials. Also, it does not get in the way of the learning experience or becoming burdensome. Short, simple and general questions that use a Likert scale style response offers a low threshold for interaction. When applied across student groups and contents form a fuller picture of the overall impressions learners have towards the content and experience.
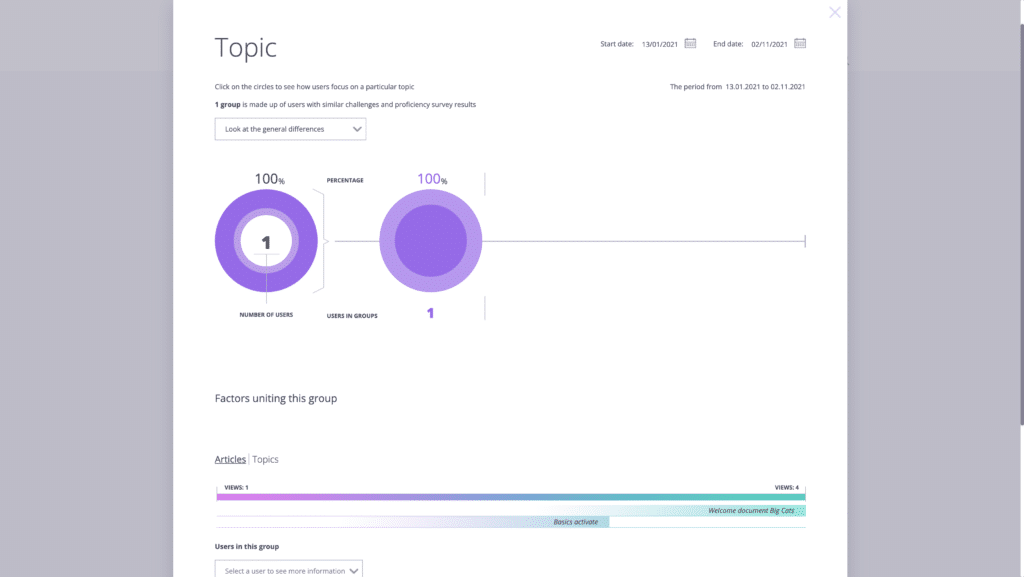
Again, such a feature can be enhanced by AI technology. It can look at responses to a particular piece of content, topic group or theme as a whole. These reactions will form patterns, and those patterns are what we’re after with learning analytics of this type. They reveal the general sentiment of learners towards the content and learning experience. We can group them according to connecting factors – e.g. 2/3 of learners found content on topic x very interesting. Of course, we could break these groups and look at individuals’ experiences. This may be necessary in the case of outliers.
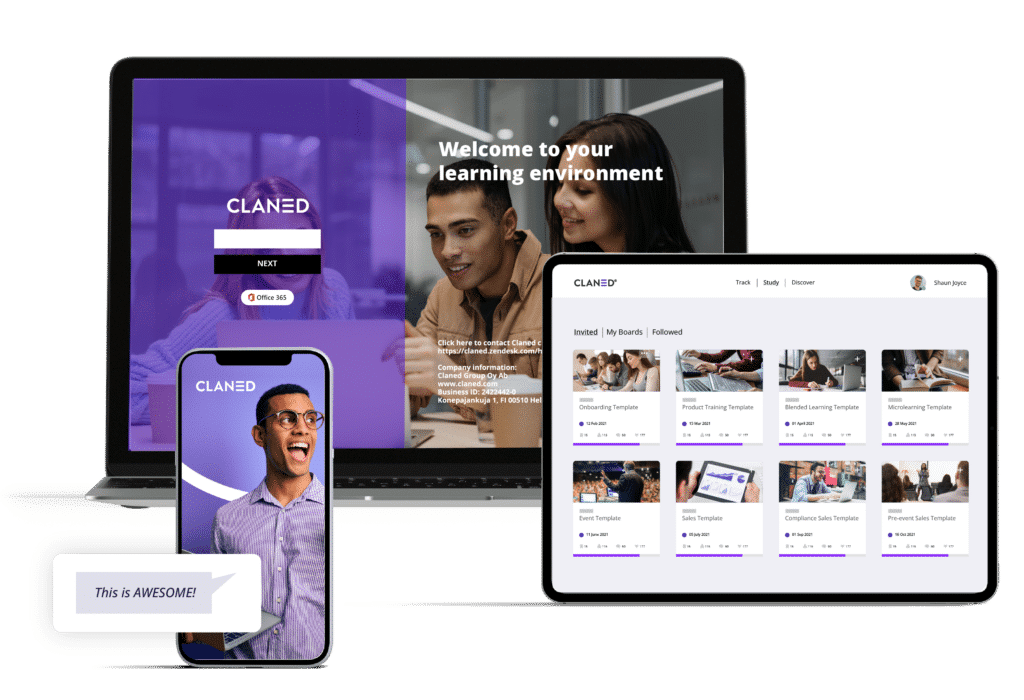
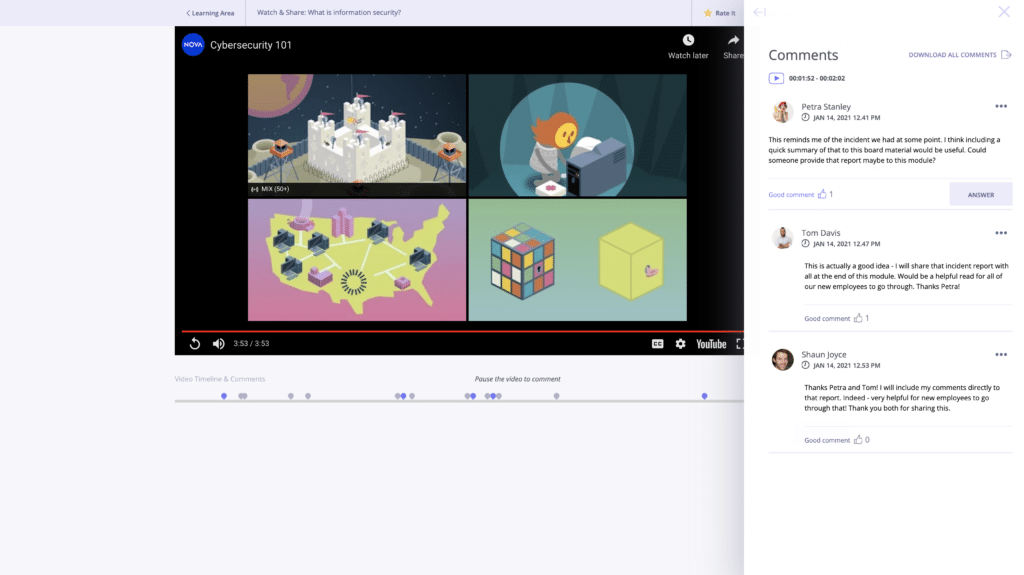
Finally, we could consider looking at the social interactions among learners. Chats and discussion boards are one means of collecting this information. If your LXP includes features such as contextual commenting on learning materials (Like CLANED® does), we get an even more robust data set to work off. Consider traditional classroom discussions; the best ones typically happen when something specific or interesting is touched upon. An opinion gets stated, or a question is asked that gives rise to a discussion. From the perspective of learning scientists, these moments are rich incidents of social and collaborative learning. Learners become engaged with the subject matter. Their knowledge and experience, and that of their peers, sharing and communicating interpretations and ideas.
Taking this process, a step further
Enabling these types of interactions in online and asynchronous learning is possible and beneficial to the learning process. We understand now that many comments typically mean higher engagement and the possibility of deeper discussions arising.
Again we can turn to AI and machine learning to take this process a step further. By running a semantic analysis program on the collection of comments, questions and discussions that occur during a course, we can uncover the attitude or feelings learners experience during the learning process. These sentiments are categorised broadly into positive and negative emotions, enjoyment, confusion etc.
Here, you can see how learners feel about their learning or course in an evidence-based way Instead of relying on answers to questions asked at the end of a program. Culture, personality and insecurities that often affect these types of responses are no longer a factor. We can look at the entirety of communication and identify the emergent patterns over a large timescale.
Last thoughts on learning analytics
All this might seem like a great challenge, requiring a great deal of sophisticated technology running in the background. Luckily, at CLANED®, we love a good challenge. We have inbuilt a suite of analytics to do just these kinds of measurements. What’s more, we take the guesswork out of the interpretation or learning how to set up specific measurements. We instead offer this information as real-time reports.
The metrics are marked with clear descriptions, so you know what they are what they do. You can monitor the related interactions, watch patterns emerge, identify at-risk learners, intervene before real trouble occurs. This increases the odds and level of success in a learning program. After the conclusion of a course, you can build comprehensive pictures of what worked and what could be improved. You can even gain insight into how to improve low performing areas.
Distinguishing between low engagement because the content was poorly presented versus too challenging is critical. If we want to make smart, informed decisions about interventions, developing and improving the course offering. If this reminds you of the definition and value of analytics mentioned at the beginning, then good on you, smart cookie!
Learning analytics is helpful in just these scenarios to monitor and increase learner success. It improves and influences how and what we wish them to learn. Perhaps, it’s clear by now but is worth stating – these two things go hand-in-hand. Learner success is directly connected to how the learning activities, materials, and content are presented and delivered.
With this idea in mind, it is perhaps clear why analytics are a vital aspect of modern learning. It serves not only to understand and support learners but also to accomplish effective, enjoyable, and meaningful learning experiences.
If you’d like to read more content like this, then check out Chris‘s post. Why you should be incorporating online learning.
Learning analytics is awesome right? If you’d like to incorporate this in your organization, just click on the image below